


Florida Tourism: Growth Without Guardrails
The problem is not that people want to visit Florida. The problem is that the system designed to attract them
Read More“Local Opinion and Commentary”
The problem is not that people want to visit Florida. The problem is that the system designed to attract them
Read More
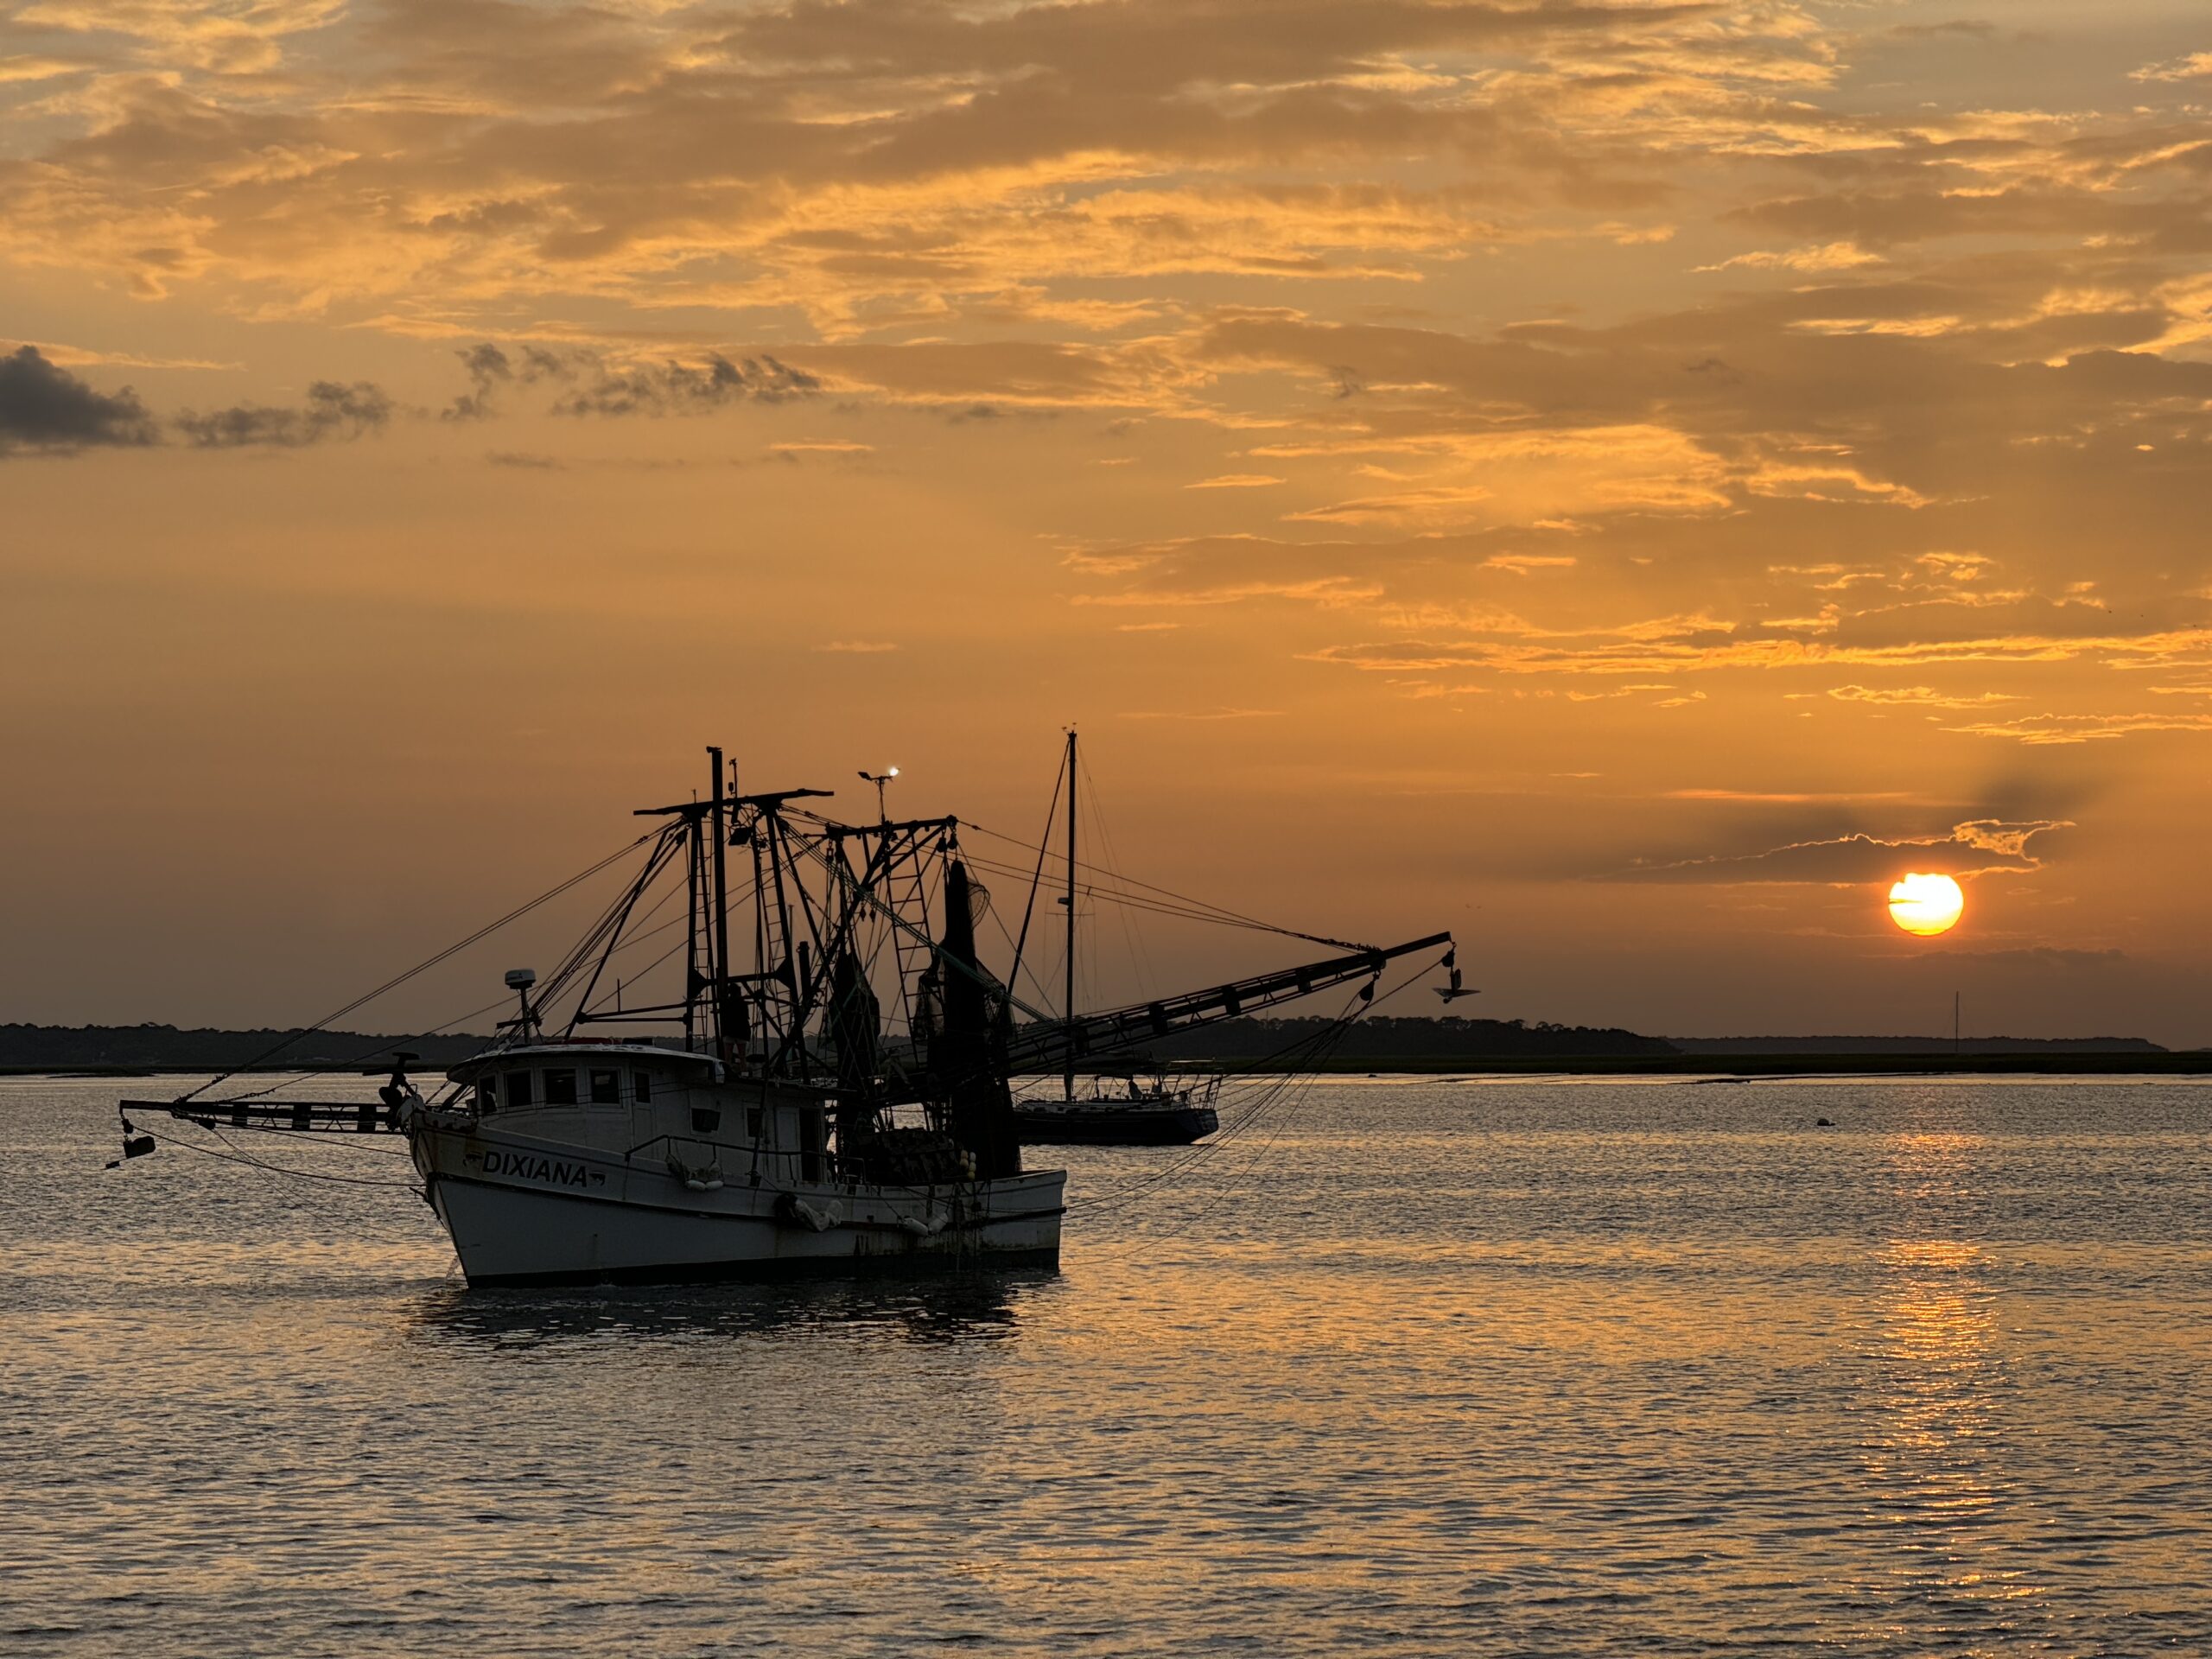
Featured photo: A rare west swell breaking in the river during last year’s hurricane season. Most people don’t realize this
Read More
I walked out onto the porch early this morning and sat for a few minutes watching the day begin. At
Read More
Flock Cameras, AI, and Privacy: A Conversation Worth Having The discussion about Flock license plate cameras isn’t really about cameras
Read More
What June’s Real Estate Numbers Mean for Nassau County Screenshot If you’ve been hearing that the real estate market is
Read More
Why Do Candidates Wait Until the Last Minute to Paint Their Opponents in a Negative Light? If you’ve followed politics
Read More
**2026 Florida Governor Race: Latest Polling Snapshot and Candidate Breakdown** With the Republican primary just a month away and the
Read More
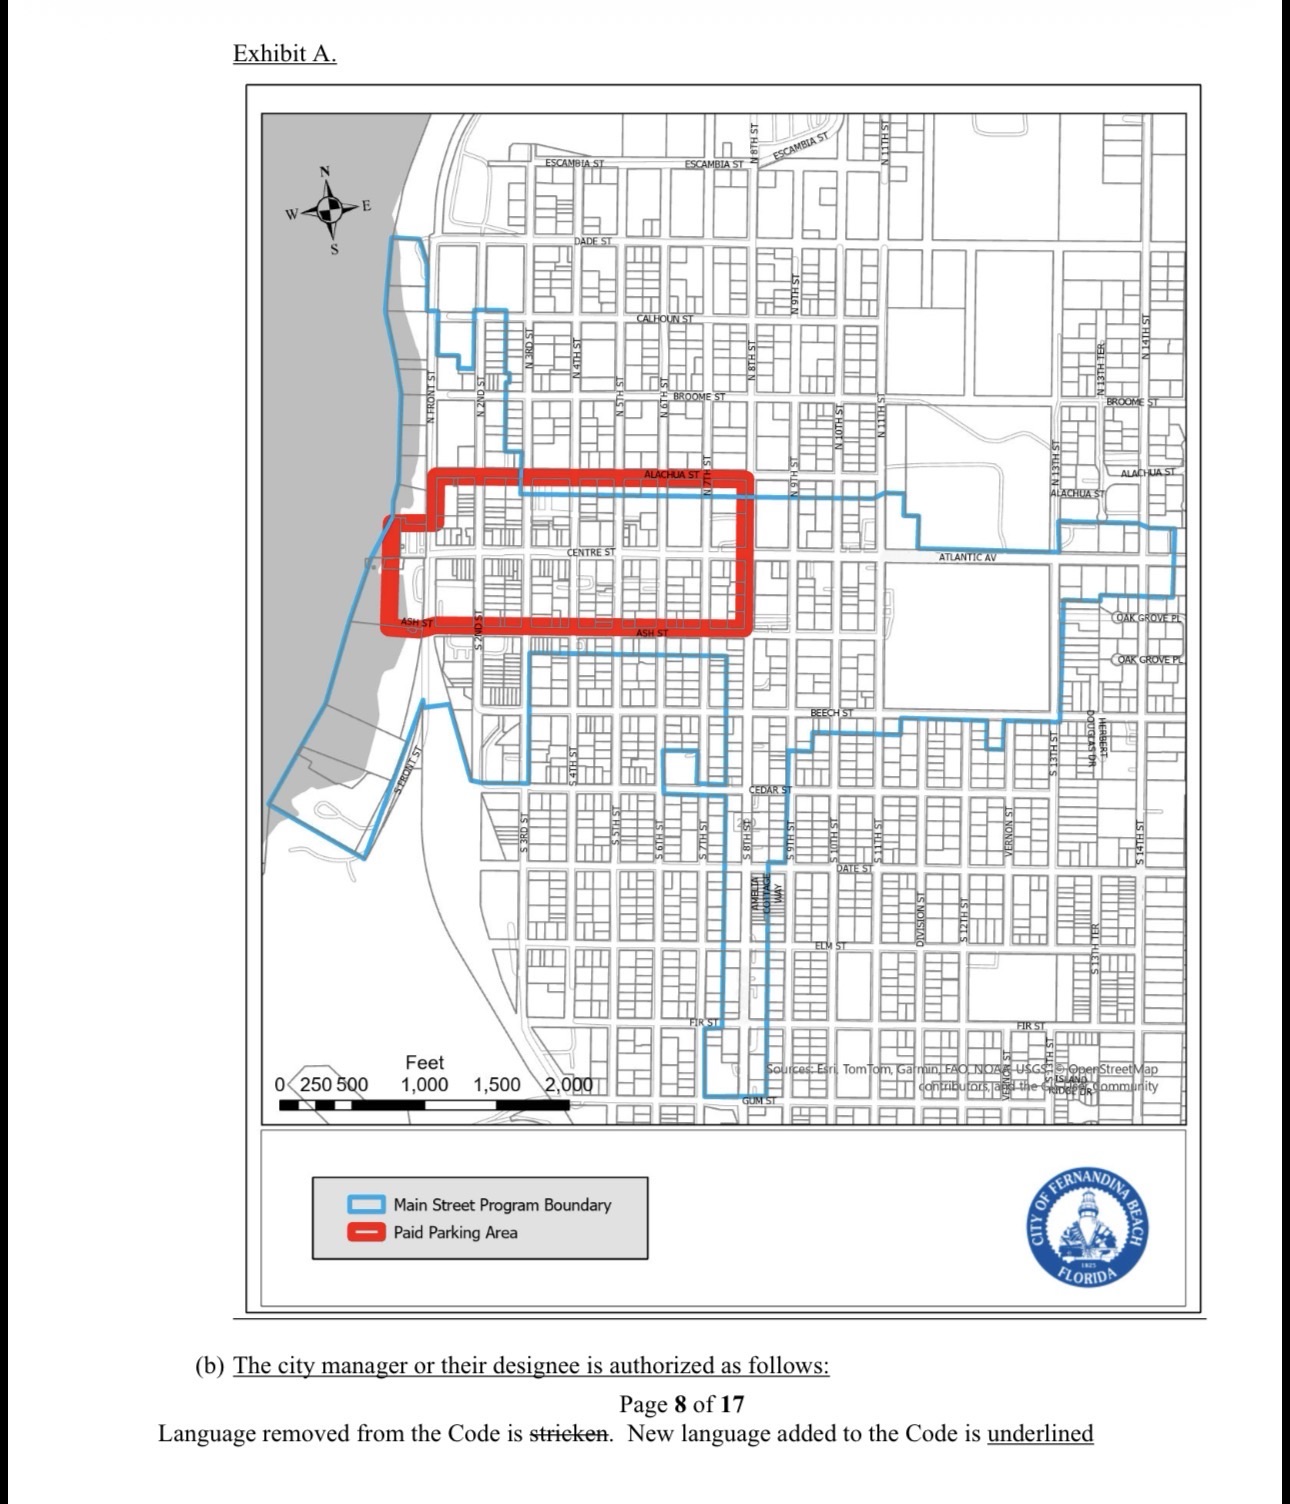
I’ve spent time going through the city’s Ordinance 2026-10 and the March 2026 rate study that supports it. If you
Read More
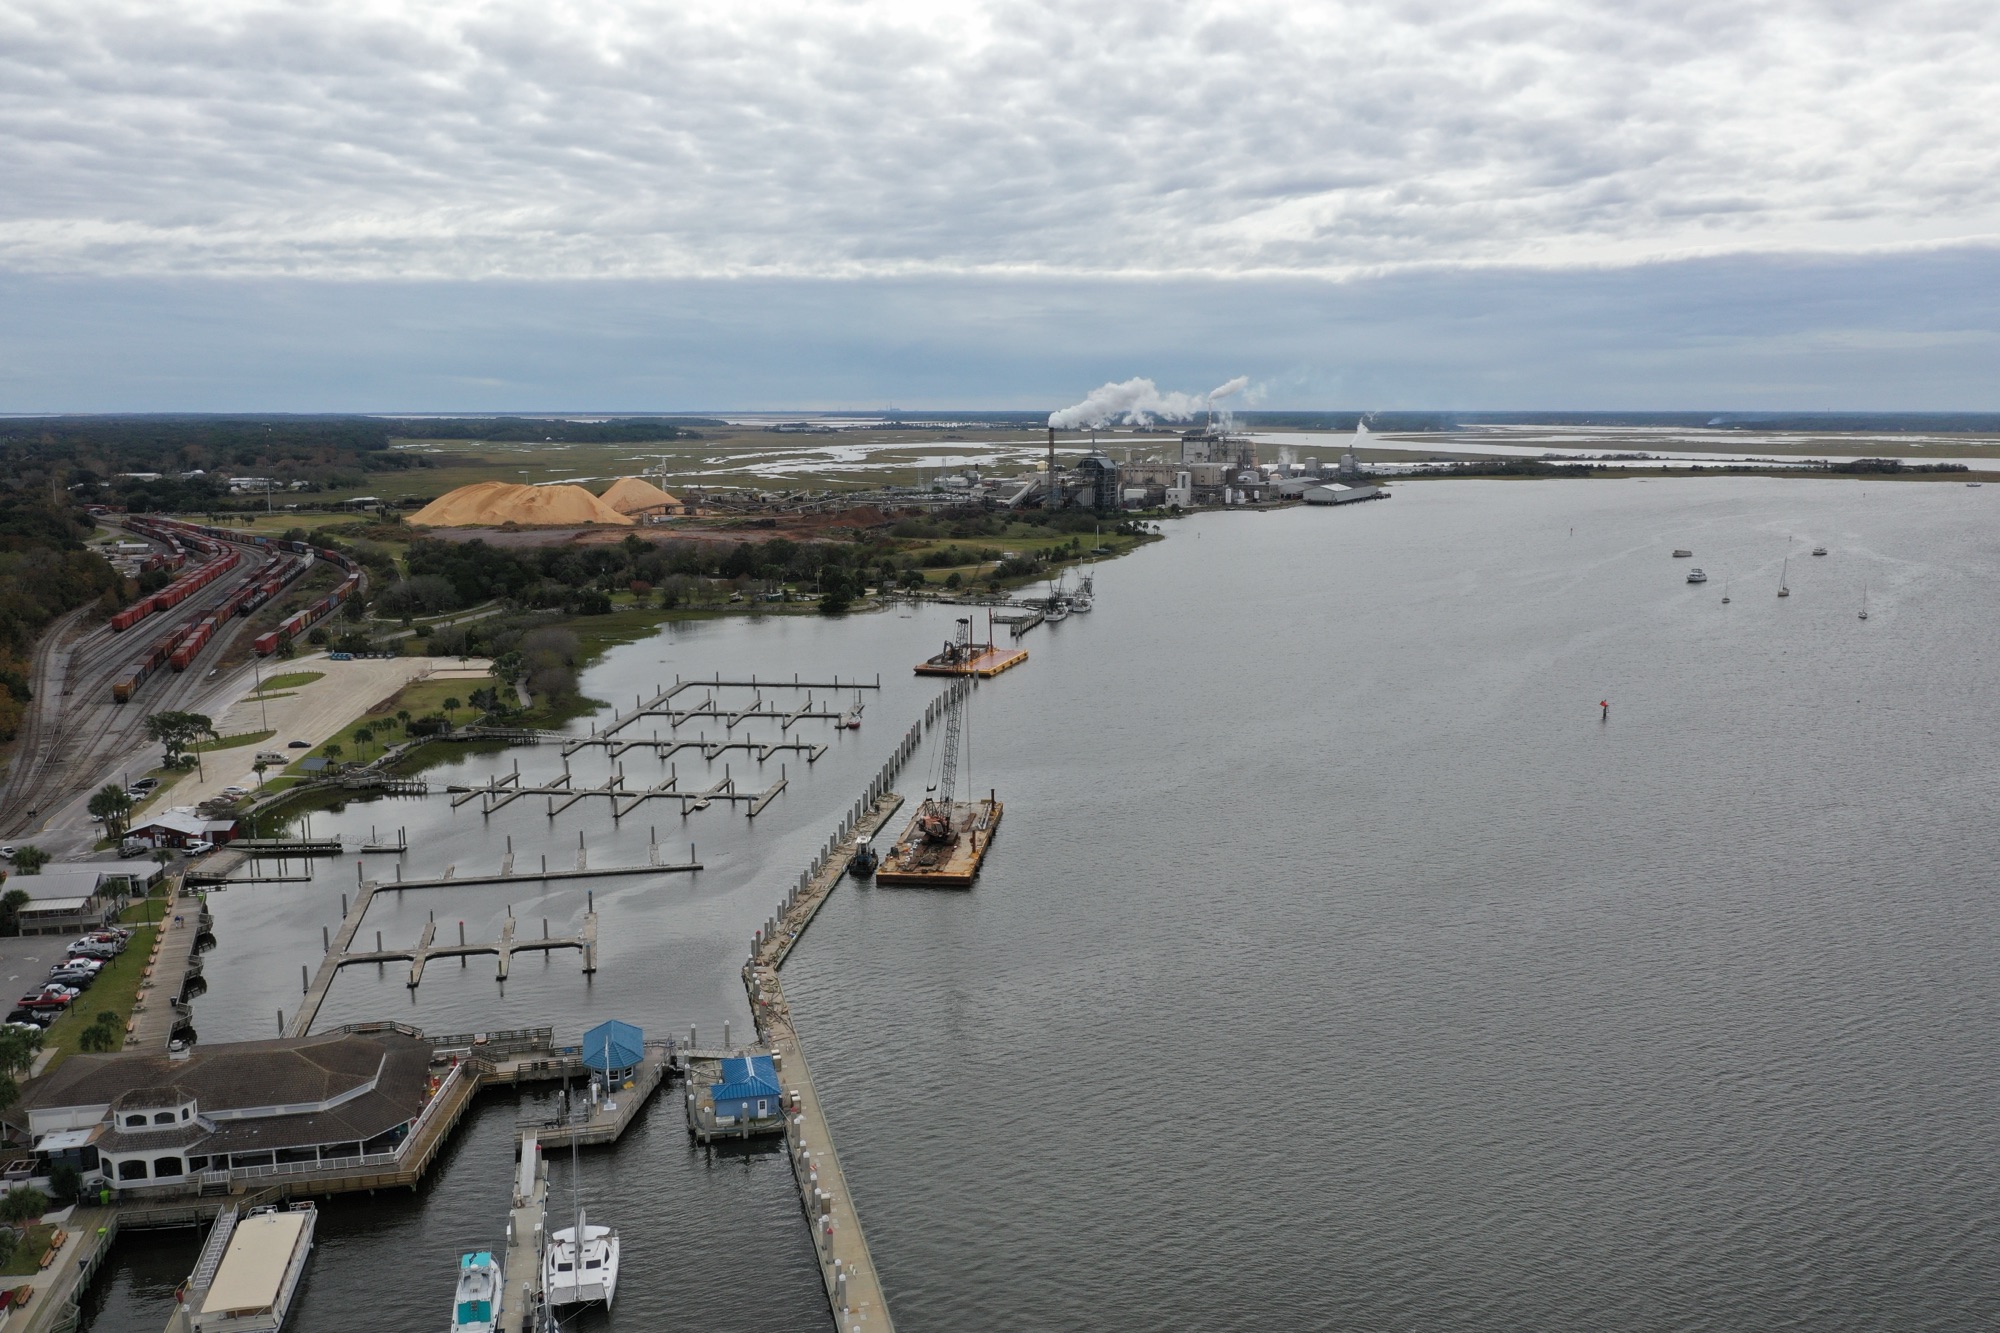
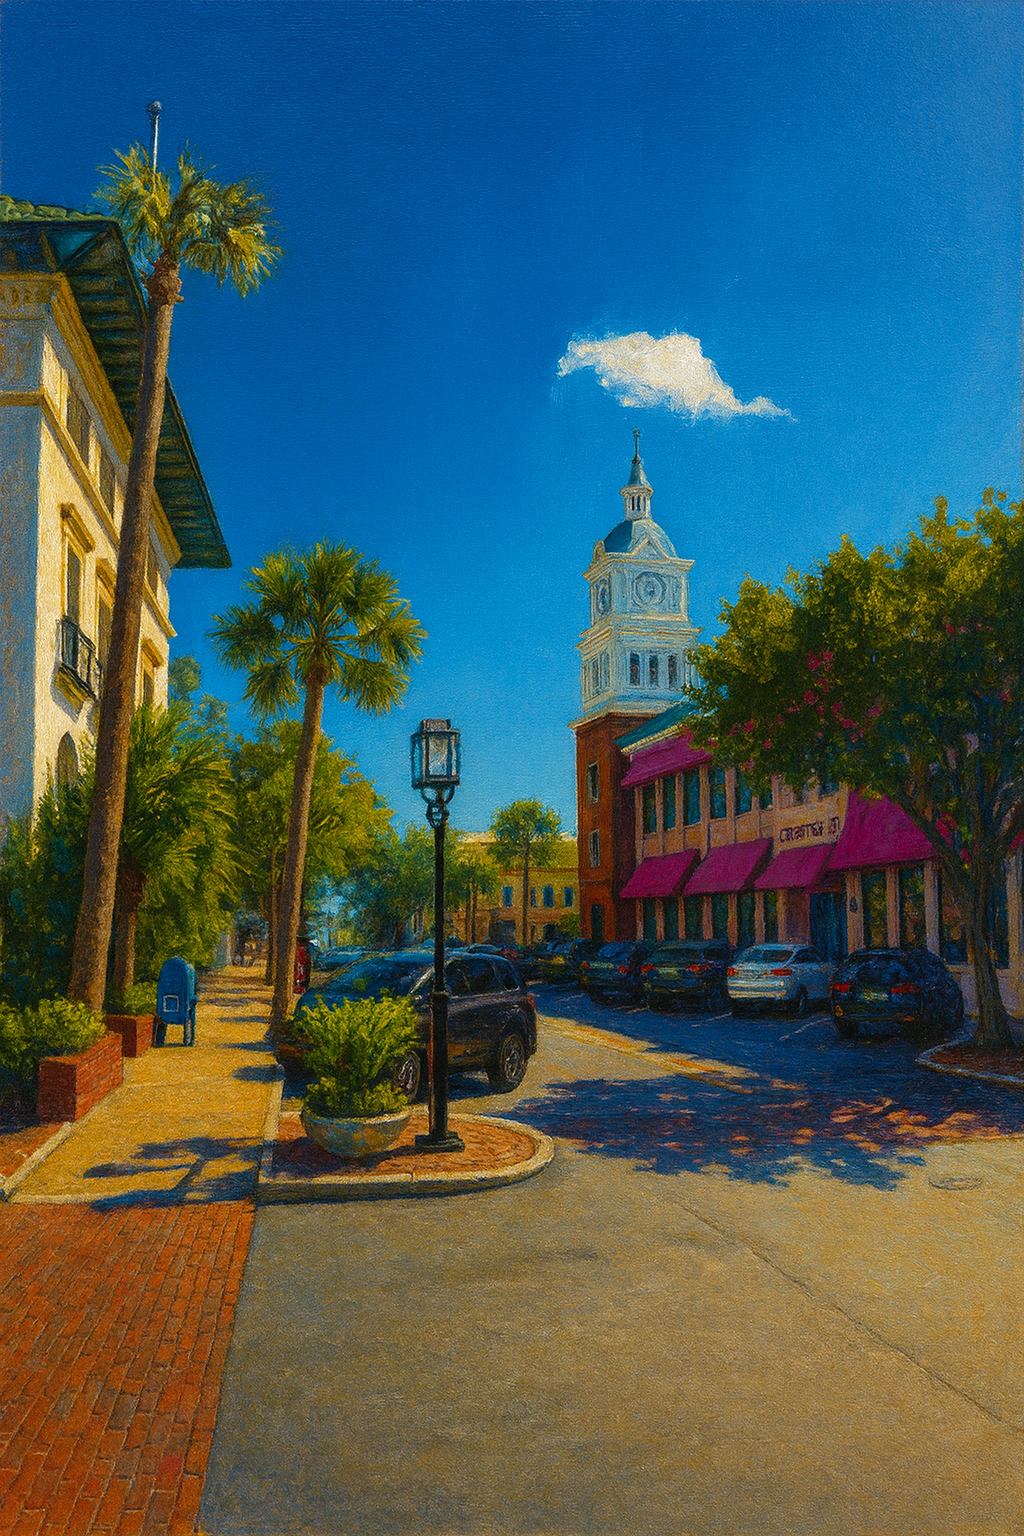
Recent reporting in the Fernandina Observer outlined a measurable decline in activity at the Port of Fernandina. Cargo tonnage for
Read More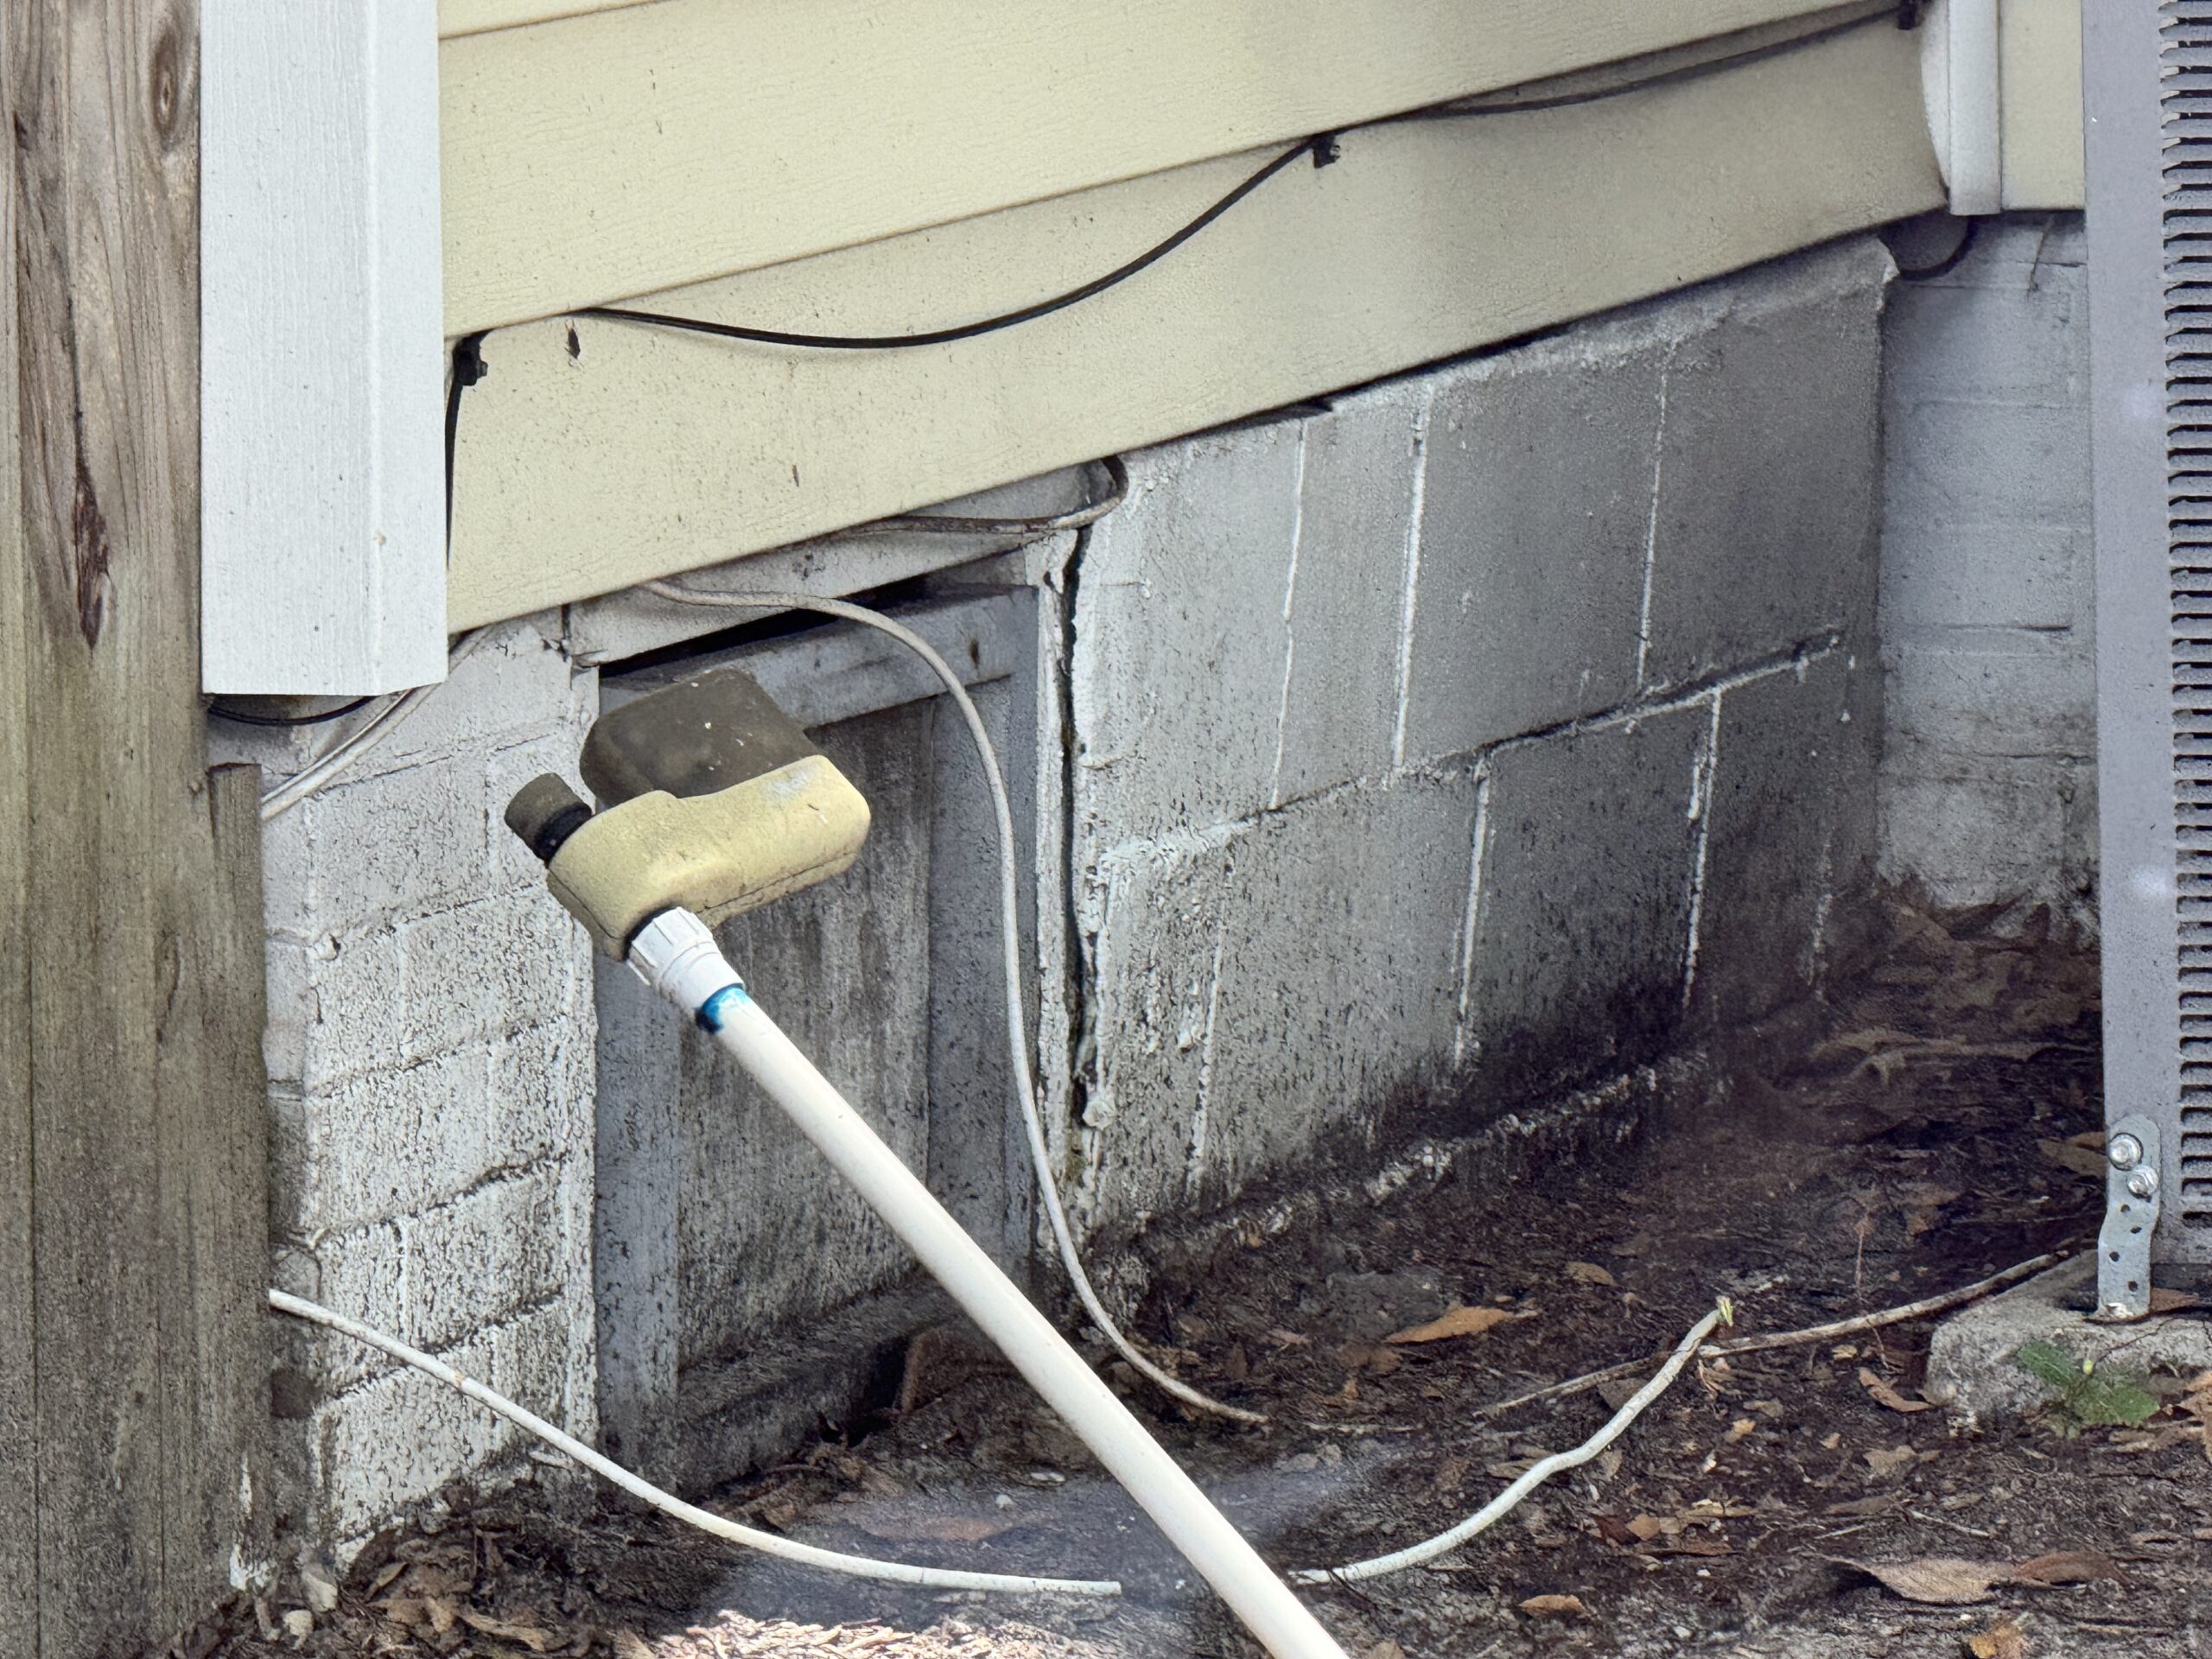
Many older homes in Florida were built on pier-and-beam foundations or raised masonry foundations with open crawlspaces. These spaces were
Read More